Insights PUE benchmarks
EU Data Centre PUE 2025: Benchmarks by Size and Country
773 sites reported 2025 operations to the EU database at PUE 1.27. Benchmarks by size and country, and why the fall from 1.36 is not a trend.

Key takeaways
- The Commission’s public dashboard shows an energy-weighted PUE of 1.27 for 773 data centres in 11 countries. The figures describe calendar year 2025, were due by 15 May 2026, and cover only the sites that have reported. They are not a count of all EU data centres.
- Size decides the average. The 90 sites above 10 MW are 12% of the count but used 67% of the energy and 80% of the water, at a PUE of 1.19. The other four size bands sit between 1.40 and 1.60.
- Germany supplies 454 of the 773 sites (58.7%) but about a third of the reported energy. Country averages run from 1.14 in Belgium to 1.44 in Austria.
- The move from 1.36 in the dashboard’s 2024 set to 1.27 for 2025 cannot be read as an efficiency gain, because the set of reporting sites changed. Dutch reported energy alone rose from 0.88 to 5.68 TWh. The 1.36 in the Commission’s September report belongs to the first round, which the dashboard files under 2023 at 1.37.
- Compare your site with its size band and, where one exists, its country and size cell. A German site of 1 to 2 MW sits beside an average of 1.38; the EU band average is 1.44.
The first number most operators will see is 1.27. That is the weighted average power usage effectiveness (PUE) on the European Commission’s public data-centre dashboard for 2025. PUE is total data-centre energy divided by the energy used by the IT equipment alone. A PUE of 1.27 means 27 kWh of cooling, power conversion and other overhead for every 100 kWh the servers use.
The figure comes from reports under Article 12 of Directive (EU) 2023/1791, which applies to data centres with at least 500 kW of installed IT power. Delegated Regulation (EU) 2024/1364 sets the indicators. This article reads the dashboard’s tables by size, country and type, gives the benchmark rows an operator needs, and says what a site operator can and cannot conclude from them. Dashboard figures are as last updated on 25 September 2026 and were read again on 10 October 2026. Our EED reporting guide covers the reporting duty itself.
| Figure | Value | Period | Source |
|---|---|---|---|
| Energy-weighted averages, EU reporting population | PUE 1.27, WUE 0.51 m³/MWh IT, REF 0.84, ERF 0.0236; 773 sites, 11 countries, 20.7 TWh, 4.4 GW installed IT power | Calendar year 2025 (dashboard reporting period 2025, deadline 15 May 2026) | European Commission EED data-centre dashboard, last updated 25 Sep 2026, CC BY 4.0 |
What the 2025 dashboard covers
The 2025 view lists 773 data centres in 11 countries. The dashboard’s country filter offers 23 country codes, and the EU has 27 member states, so most countries are missing. The overview shows 20.7 TWh of energy use, 4.4 GW of installed IT power and 8,752,919 m³ of water input. The nine countries with published energy figures add up to 20.68 TWh and 4.37 GW; the three Cypriot and Maltese sites, whose figures are withheld, make up the small remainder. If those 20.7 TWh cover a full year, the average draw is about 2.4 GW (20.68 TWh divided by 8,760 hours).
The dashboard’s About sheet says it shows aggregated data from the data centres that fulfilled their reporting obligation. The numbers describe those sites. They do not describe the EU stock.
The other three indicators are ratios in the same style. Water usage effectiveness (WUE) is water input divided by IT energy in megawatt-hours, so the headline 0.51 means 0.51 m³ per MWh, the same as 0.51 litres per kWh. The renewable energy factor (REF) is the renewable share of total energy, 0.84 in the headline. The energy reuse factor (ERF) is the share of energy sent out as reused heat, 0.0236 in the headline, or 2.4%. REF counts renewable energy bought through guarantees of origin and power purchase agreements as well as on-site generation, so 84% does not measure what physically flows into the building.
Which year the “2025” figures describe
Article 3(1) of the delegated regulation sets the reporting dates: 15 September 2024, then 15 May 2025 and every year after. The same article says the indicators “shall cover the calendar year immediately preceding the reporting year”. So a submission filed by 15 May 2026 describes 2025.
The dashboard’s filter offers 2023, 2024 and 2025 and does not say what they mean. Its data model does. Each reporting period carries a single report deadline: 2023 goes with 15 September 2024, 2024 with 15 May 2025, and 2025 with 15 May 2026. That pairing is what we observed in the dashboard. Put it next to Article 3(1) and the label can only be the year of operation. The 2025 set is therefore the third round of filings.
The Commission’s own documents count the other way. Its topic page calls the round filed by September 2024 “the 2024 reporting period”, and its September 2026 report to Parliament and Council, COM(2026) 500, says “In 2024, the average reported PUE of data centres in the EU stood at 1.36” for that same first round. On the dashboard that round is 2023, with 646 sites and a PUE of 1.37. The report counted 770 sites and computed its 1.36 from the 681 whose PUE passed its quality checks. Neither document explains the gap between 770 and 646. When you quote a figure, give the dashboard period and the calendar year it covers. Deadlines for the next rounds are in our European data centre regulation tracker.
Size category: the larger the site, the lower the PUE, with one exception
Source: European Commission data-centre dashboard, CC BY 4.0, reporting period 2025 (calendar year 2025), read 29 Sep 2026, chart by ScienceShot.
The five categories follow the installed IT power bands in Annex IV of the regulation. The dashboard table gives these 2025 averages: very small 1.52 (143 sites), small 1.60 (178), medium 1.44 (185), large 1.40 (177) and very large 1.19 (90). From small to very large, weighted PUE falls in every step.
Annex IV tells the Commission to average each indicator “using the total energy consumption as the weighting factor”. The dashboard’s formula does exactly that: each band’s PUE is the sum of every site’s PUE times its energy, divided by the band’s total energy. A site that uses 100 GWh counts ten times as much as a site that uses 10 GWh. An average very large site in this set (153.6 GWh a year) therefore counts about 68 times as much as an average very small one (2.3 GWh).
| Size band (installed IT power) | Sites | Share of energy | Energy per site, GWh | PUE | WUE, m³/MWh IT | REF | ERF |
|---|---|---|---|---|---|---|---|
| Very small, 100 to 500 kW | 143 | 1.6% | 2.3 | 1.52 | 0.186 | 0.82 | 0.0466 |
| Small, 500 to 1,000 kW | 178 | 4.2% | 4.9 | 1.60 | 0.335 | 0.76 | 0.0232 |
| Medium, 1 to 2 MW | 185 | 8.1% | 9.0 | 1.44 | 0.206 | 0.89 | 0.0296 |
| Large, 2 to 10 MW | 177 | 19.4% | 22.7 | 1.40 | 0.447 | 0.91 | 0.0264 |
| Very large, above 10 MW | 90 | 66.8% | 153.6 | 1.19 | 0.581 | 0.82 | 0.0215 |
| All sites | 773 | 100% | 26.8 | 1.27 | 0.51 | 0.84 | 0.0236 |
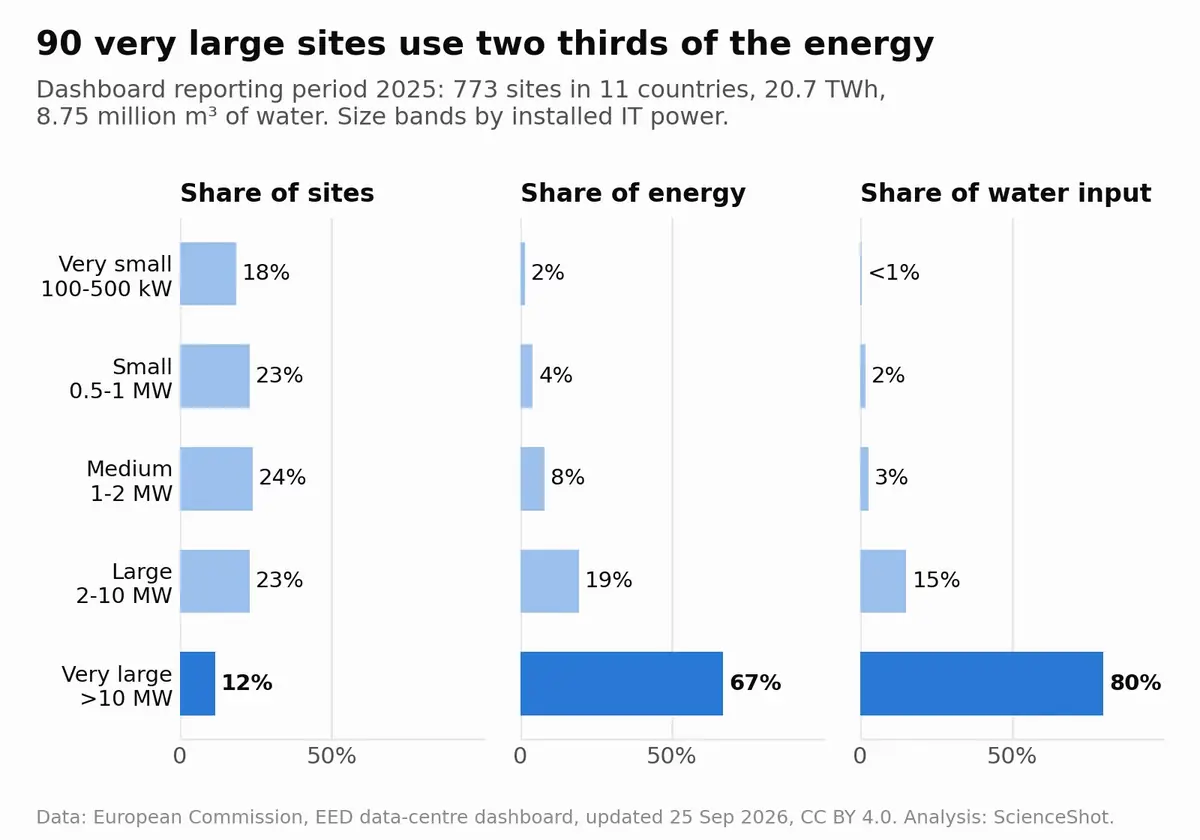
The very large band sets the headline. Its 1.19 carries two thirds of the weight, which is why the EU figure of 1.27 sits below every other band. Ninety sites, 12% of the list, decide where the EU average lands. Water runs the other way. WUE climbs from 0.186 in the very small band to 0.581 above 10 MW, and those 90 sites took in 7.0 of the 8.75 million m³ reported.
COM(2026) 500 offers an explanation for the water pattern: “WUE tends to increase with facility size, likely due to the rare use of evaporative cooling in smaller facilities.” The dashboard records no cooling technology, so treat that as the Commission’s reading of the first round. The report found the same size effect on PUE then, with 500 to 1,000 kW sites at 1.64.
The exception is the very small group. Its average, 1.52, is lower than the small group’s 1.60. The table has no spread, so it cannot say whether a few poor sites lift the small average or whether most small sites are poor. The very small band covers 100 to 500 kW, below the EU threshold of 500 kW, yet it holds 143 sites. 124 of them are German. The Commission’s report notes that “data centres above 300 kW in Germany have to report their data”, which fits a band made up mostly of German sites.
The simple average of the five band values is not the headline and should not be quoted as one.
EU data centre PUE by country
Source: European Commission data-centre dashboard, CC BY 4.0, reporting period 2025 (calendar year 2025), read 29 Sep 2026, chart by ScienceShot.
Germany reports 454 of the 773 sites, or 58.7%. It is tempting to read the 1.27 as a German number. The energy column says otherwise. Germany reports 6.86 TWh, about 33% of the 20.68 TWh with published values, at a weighted PUE of 1.36. The Netherlands reports 80 sites but 5.68 TWh (27%) at 1.22. Together the two countries report about 61% of the energy.
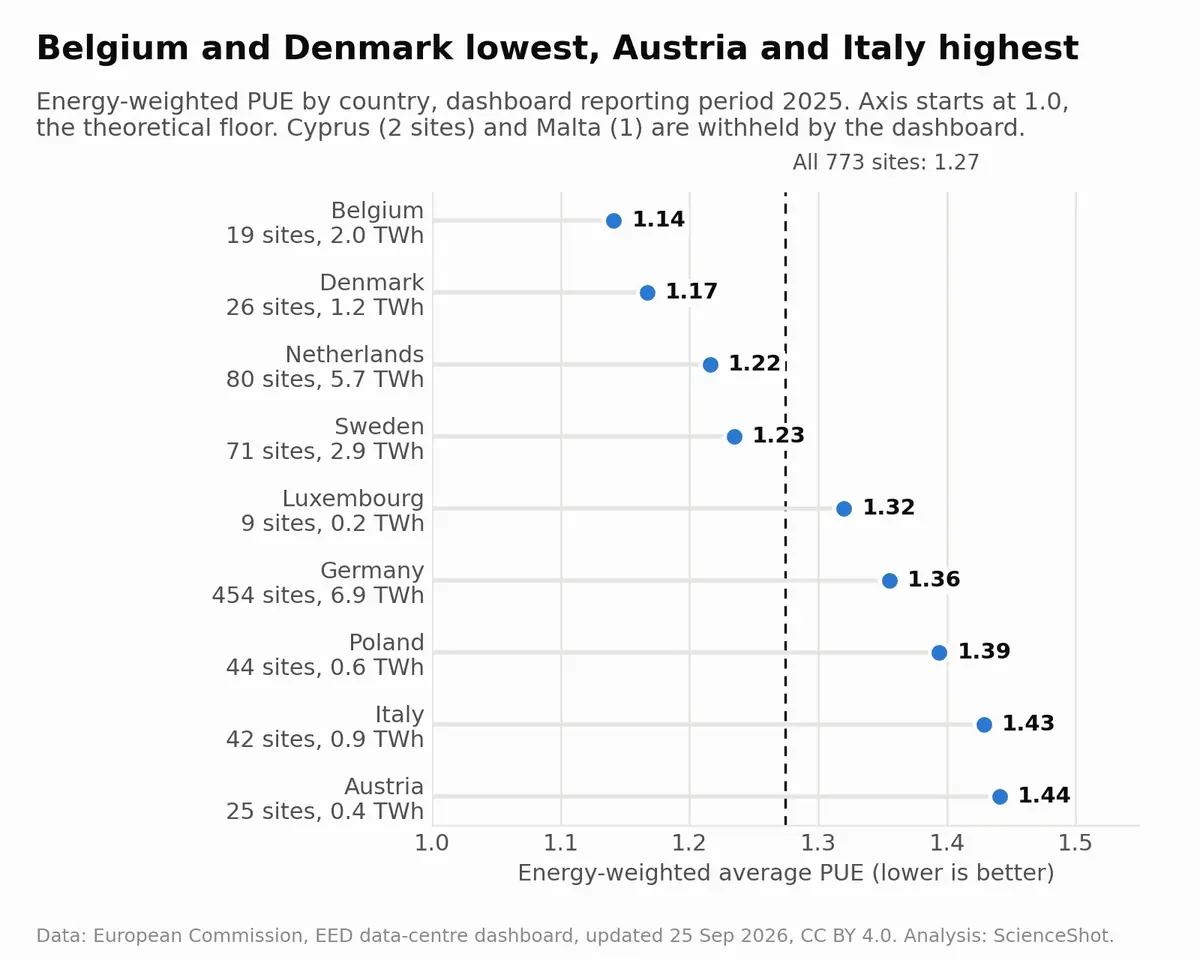
Belgium (1.14) and Denmark (1.17) report the lowest averages. The Netherlands and Sweden follow at 1.22 and 1.23, Germany sits at 1.36, and Austria is highest at 1.44. Average site size differs widely. A German site in the table uses about 15 GWh and a Dutch site about 71 GWh. Belgium’s 19 sites average 104.5 GWh each, the largest per-site figure in the set, and they also report the highest WUE, 1.442 m³ per MWh.
Weighting the rounded country values by energy gives about 1.28, which agrees with the dashboard’s 1.27 within rounding. Without Germany, the same sum gives about 1.23. Both are recalculations from rounded inputs, so treat them as approximate.
| Country | Sites | Energy, GWh | Installed IT power, MW | Water input, m³ | PUE | WUE | REF | ERF |
|---|---|---|---|---|---|---|---|---|
| Austria | 25 | 395.7 | 72.2 | 48,905 | 1.44 | 0.189 | 0.83 | 0.0303 |
| Belgium | 19 | 1,985.9 | 341.1 | 2,640,407 | 1.14 | 1.442 | 1.00 | 0.0000 |
| Cyprus | 2 | n/a | n/a | n/a | n/a | n/a | n/a | n/a |
| Denmark | 26 | 1,175.5 | 318.8 | 676,983 | 1.17 | 0.674 | 1.00 | 0.1475 |
| Germany | 454 | 6,860.1 | 1,507.8 | 2,002,822 | 1.36 | 0.399 | 0.84 | 0.0268 |
| Italy | 42 | 863.6 | 131.9 | 103,340 | 1.43 | 0.158 | 0.88 | 0.0031 |
| Luxembourg | 9 | 155.7 | 52.1 | 37,678 | 1.32 | 0.310 | 0.57 | 0.0009 |
| Malta | 1 | n/a | n/a | n/a | n/a | n/a | n/a | n/a |
| Netherlands | 80 | 5,676.7 | 1,123.7 | 3,074,477 | 1.22 | 0.642 | 0.79 | 0.0028 |
| Poland | 44 | 638.9 | 124.3 | 28,011 | 1.39 | 0.068 | 0.69 | 0.0117 |
| Sweden | 71 | 2,929.7 | 698.7 | 140,204 | 1.23 | 0.059 | 0.81 | 0.0318 |
| All 11 | 773 | 20,696.3 | 4,373.6 | 8,752,919 | 1.27 | 0.51 | 0.84 | 0.0236 |
Cyprus (2 sites) and Malta (1 site) show “n/a” for every indicator. The dashboard’s own formula withholds any cell with fewer than three sites, and Annex IV sets the same three-site minimum for type and size averages.
France, Spain and Finland have no 2025 rows yet. If your site is there, the most recent figures are for 2024 operations: France 1.49 across 152 sites, Spain 1.57 across 38, Finland 1.16 across 28. Read them as context for a different year and a different set of sites.
Renewable share needs care. A REF of 1.00 in Belgium and Denmark means the reported renewable energy matches total consumption over the year, and across the first round the Commission’s report found that a large share of renewable energy came through power purchase agreements and guarantees of origin “not necessarily connected to local production”. What the grid actually delivers hour by hour is a separate question, which our live European grid page tracks for the main data-centre markets.
Country and size together
Select a country in the dashboard’s filter and its size table changes to that country’s bands. That cell is the closest public peer group a site has. The table below collects it for the four countries with the most sites in 2025, plus France from 2024, since France has no 2025 data yet.
| Size band | EU 2025 | Germany 2025 | Netherlands 2025 | Sweden 2025 | Poland 2025 | France 2024 |
|---|---|---|---|---|---|---|
| Very small, 100 to 500 kW | 1.52 / 0.186 (143) | 1.51 / 0.163 (124) | 1.44 / 0.572 (4) | 2.18 / 0.048 (3) | 1.42 / 0.056 (3) | 1.85 / 0.093 (21) |
| Small, 0.5 to 1 MW | 1.60 / 0.335 (178) | 1.55 / 0.294 (87) | 1.56 / 0.496 (25) | 1.56 / 0.093 (20) | 1.57 / 0.047 (16) | 1.77 / 0.082 (29) |
| Medium, 1 to 2 MW | 1.44 / 0.206 (185) | 1.38 / 0.177 (112) | 1.35 / 0.560 (12) | 1.46 / 0.072 (17) | 1.52 / 0.186 (11) | 1.63 / 0.080 (26) |
| Large, 2 to 10 MW | 1.40 / 0.447 (177) | 1.39 / 0.517 (96) | 1.33 / 0.925 (19) | 1.49 / 0.117 (16) | 1.37 / 0.076 (11) | 1.55 / 0.272 (60) |
| Very large, above 10 MW | 1.19 / 0.581 (90) | 1.30 / 0.412 (35) | 1.18 / 0.618 (20) | 1.16 / 0.046 (15) | 1.24 / 0.005 (3) | 1.29 / 0.339 (16) |
German sites above 10 MW average 1.30, well above the EU band’s 1.19, while German medium sites at 1.38 beat the EU medium band. Sweden’s large sites (1.49) sit above its medium ones (1.46). The dashboard publishes a cell once it reaches three sites, and a cell of three or four is close to a single facility. So Sweden’s 2.18 for very small sites says little about Swedish operators in general.
Type table: read the labels before the numbers
The type table has ten rows. Each label combines a business model (colocation, enterprise or co-hosting) with a building layout (a single structure or a group of structures), sometimes with extra services. The largest rows by site count are colocation in a single structure (282 sites, PUE 1.35), enterprise in a single structure (257 sites, 1.49) and co-hosting in a single structure (59 sites, 1.22). The row that weighs most in the average is a small one. Its 35 enterprise sites built as groups of structures average 1.13 and used 7.46 TWh, about 36% of all reported energy. Single-structure colocation sites used 7.08 TWh. One row has two sites and is withheld. Each row mixes sizes and countries, so use the table to find your own row and leave business models unranked.
What the figures do not show
The 2025 set covers 11 countries. Load dates in the data run from 22 April to 7 September 2026 and the last update is 25 September 2026, so later national batches or corrections may still move the averages. The dashboard’s counts also run below the Commission’s: 646 sites against the report’s 770 for the first round, and 829 for the second round, where the report says preliminary data came from “at least 30% more data centres” than the first, which implies about 1,000. Neither source explains the difference.
The years are not a series. For the nine countries published in both 2024 and 2025, the energy-weighted PUE moves from 1.33 to 1.27, but reported energy in those same countries nearly doubles, from 11.0 to 20.7 TWh, and sites rise from 574 to 770. The Netherlands went from 61 sites and 0.88 TWh to 80 sites and 5.68 TWh, with installed IT power up from 124 to 1,124 MW, and its average fell from 1.44 to 1.22. Those numbers point to a different population of Dutch sites. The very small band moved from 1.72 to 1.52 over the same step, and that change cannot be separated from the change in who reports. Nothing in the dashboard measures whether any one facility became more efficient.
Every cell is one energy-weighted average. No minimum, maximum or median appears, so the tables cannot tell you how many sites beat 1.27.
The inputs are self-reported. The Commission’s reporting FAQ says PUE, WUE and ERF are “calculated by the Commission, not directly reported by the operators”, from energy and water figures that operators may estimate where shared cooling or electrical systems lack separate meters. Operators who cannot establish installed IT power may report the rated power of the UPS system instead, which the FAQ says “often results in an overestimation”. That can push a site into a larger band.
WUE methods differ. The dashboard keeps sites that report no water input in its average, at zero water (at least 43 sites in 2025). The Commission’s report averaged only validated sites with water input above zero and found 0.58 for the first round, against the dashboard’s 0.47 for the same round. Compare your WUE with the dashboard figure only if you include a zero the same way.
How to compare your own site, with a worked example
- Compute your indicators the way Annex III does, from a full calendar year. PUE is total facility energy, measured at the supply input before the transfer switchgear, divided by IT energy measured at the UPS outputs. WUE divides total water input by IT energy in MWh. Our EED KPI calculator does the arithmetic in your browser, and the tools page lists the other instruments.
- Find your band from installed IT power, the nominal power of the IT equipment on the computer-room floor: up to 500 kW very small, 500 to 1,000 kW small, 1 to 2 MW medium, 2 to 10 MW large, above 10 MW very large.
- Compare with the band row, then with your country’s cell if it has a value. Note the site count beside it. The same band comparison runs as a free PUE benchmark panel that you can embed on your own pages.
- Read the result as above or below an energy-weighted mean. The dashboard publishes no medians or spreads, so beating the mean does not place you in the better half of sites.
- Set it against the yardsticks the Commission cites. COM(2026) 500 calls PUE below 1.2 “excellent”, 1.2 to 1.5 “good” and above 1.5 a sign of “room for improvement”. It also cites Germany’s long-term targets of 1.2 to 1.3 and the Climate Neutral Data Centre Pact’s 2030 aims of 1.3 for new sites in cool climates and 1.4 in warm ones, plus a WUE of 0.4 m³ per MWh by 2040.
Take an illustrative enterprise site in Germany, not a real one, with 1.5 MW of installed IT power. In 2025 it drew 9,000 MWh at the supply input and its UPS outputs delivered 6,300 MWh to the IT load, so its PUE is 9,000 / 6,300 = 1.43. It took in 1,200 m³ of water, so its WUE is 1,200 / 6,300 = 0.19 m³ per MWh.
The site belongs in the medium band. Against the EU band (1.44 and 0.206) it sits close to the average on both counts. Against German medium sites, 112 of them averaging 1.38 and 0.177, it sits 0.05 above on PUE and slightly above on water. It is inside the Commission’s “good” range and above Germany’s long-term target band. Its German peers run more efficiently than the EU band suggests, so they are the comparison worth reporting to a board.
If your PUE sits well above the band figure, our guide to reducing PUE sets out which measures cut it and by how much in documented cases. Airflow management usually comes first, and our explainer on cold and hot aisle containment covers the trade-offs. The Commission is also consulting on possible minimum performance standards for data centres until 14 December 2026, and our consultation guide explains what is being asked.
How to cite, method and data
Source: European Commission, EED data-centre dashboard (European database on data centres, Delegated Regulation (EU) 2024/1364), reporting periods 2023 to 2025, last updated 25 September 2026, read on 29 September and 10 October 2026. Reused under the Commission’s reuse policy (Decision 2011/833/EU), which applies CC BY 4.0 (Commission Decision C(2019) 1655; legal notice). ScienceShot rounded values, converted units, calculated shares and per-site figures, and drew the charts; the Commission does not endorse this analysis. Values were read with the dashboard’s own expressions (energy-weighted indicators, cells under three sites withheld) and checked against the rendered tables. Commission report: COM(2026) 500 final, 21 September 2026. Suggested citation: ScienceShot, “EU Data Centre PUE 2025: Benchmarks by Size and Country”, updated 10 October 2026.
Updated 10 October 2026: added the size, country and country-by-size benchmark tables, energy and water shares by size band, two charts, a section on which year the figures describe, a worked example and a method note. Corrected the comparison with the Commission’s report: its first-round PUE of 1.36 matches the dashboard’s 2023 set (646 sites, 1.37), and the earlier version set it against the 2024 set (829 sites). Also corrected three statements about the dashboard: it does show energy by size band and type, it withholds any cell with fewer than three sites, and the Commission calculates PUE, WUE and ERF from the energy and water figures operators report.